KNZ Charts is a platform designed to provide investors and traders with an innovative way of analyzing stock market behavior. Instead of relying on traditional fundamental indicators, our approach focuses entirely on statistical data and historical price behavior. The main output of our analysis is the KNZ Score, a proprietary statistical indicator created from the study of over 20 years of market history.
At this stage, our platform provides detailed analysis for 110 of the most traded US stocks. Each ticker has been studied individually, considering multiple time horizons and return variations. Our long-term goal is to expand the analysis to include the top assets from all major stock exchanges worldwide.
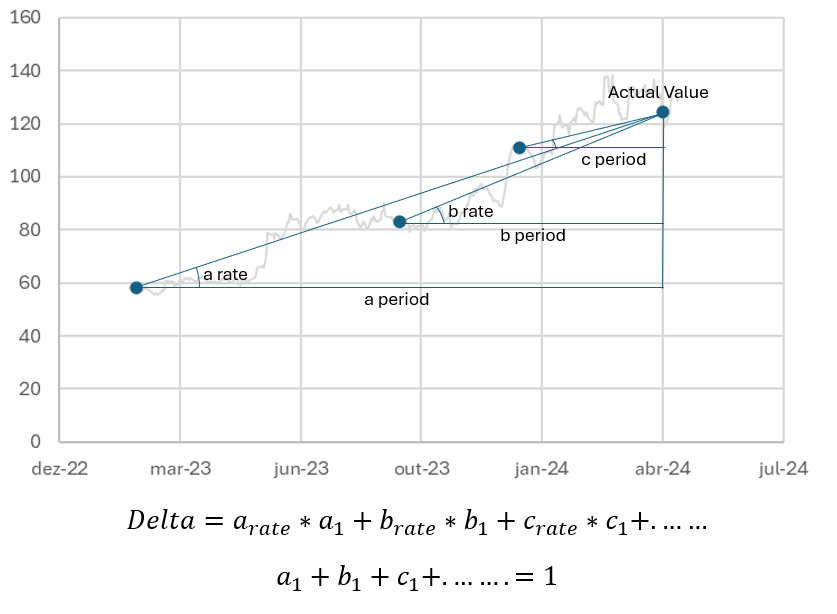
The KNZ Score is built on the assumption that markets often follow cyclical behavior. If a stock shows strong short-term gains, the probability of continuation tends to decrease, and the opposite is also true. To quantify this effect, we analyzed thousands of return rates across different time intervals and applied constant multipliers to simulate different market conditions.
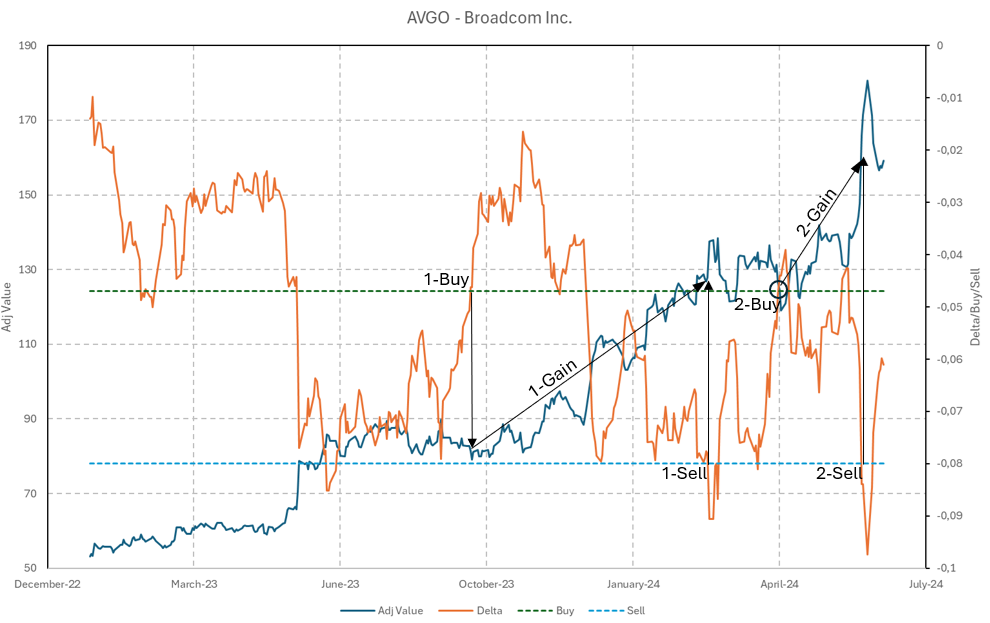
After running multiple simulations, we derived an optimized delta value for each ticker, which signals potential buy and sell points. This delta is then normalized into the KNZ Score, a standardized scale between 0 and 1 that makes comparison across different stocks easier and more intuitive.
The KNZ Score can be used as an additional tool in trading strategies. It does not replace fundamental analysis, but it offers a complementary perspective by highlighting statistical probabilities of price movement. For example:
By combining this score with charts and historical simulations, investors can quickly identify which tickers have stronger statistical signals at any given moment.
Every trading day, our system processes the latest data and updates the KNZ Score for each stock. To make the information easier to digest, we provide two summary tables:
These summaries are meant to provide a quick overview of market sentiment according to our indicator, helping traders spot opportunities more efficiently.
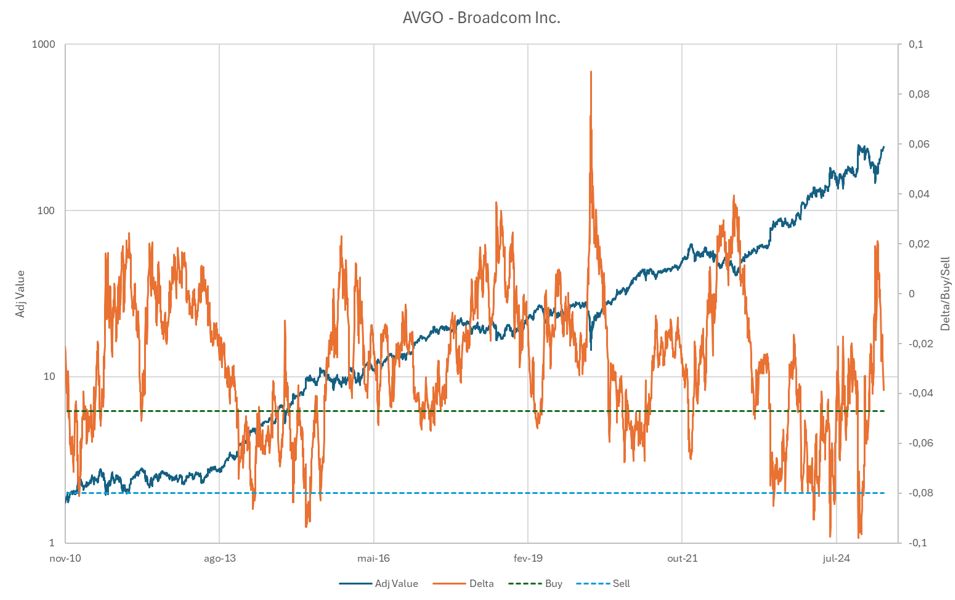
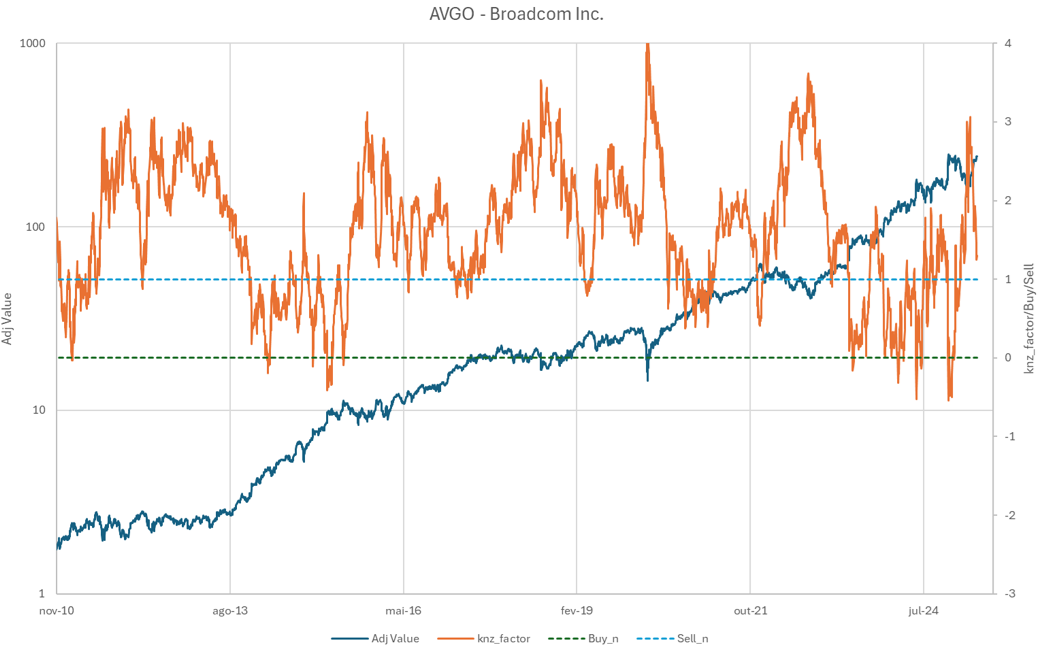
In extensive simulations conducted between 2006 and 2025, the KNZ Score successfully identified several profitable trading patterns. Some stocks demonstrated stronger short-term signals, while others revealed consistent long-term opportunities. However, not all assets responded equally, and in some cases, the method found no significant patterns of consistent gain.
The table below summarizes examples of simulated average annual returns obtained during the study period:
| Ticker | Company | Market | Average Return per year |
|---|---|---|---|
| AVGO | Broadcom Inc. | NYSE/NASDAQ/Dow Jones (USA) | 41.34% |
| TSLA | Tesla, Inc. | NYSE/NASDAQ/Dow Jones (USA) | 38.01% |
| NFLX | Netflix, Inc. | NYSE/NASDAQ/Dow Jones (USA) | 34.37% |
| NVDA | NVIDIA Corporation | NYSE/NASDAQ/Dow Jones (USA) | 31.04% |
| AMZN | Amazon.com, Inc. | NYSE/NASDAQ/Dow Jones (USA) | 25.98% |
| MA | Mastercard Incorporated | NYSE/NASDAQ/Dow Jones (USA) | 23.11% |
| AAPL | Apple Inc. | NYSE/NASDAQ/Dow Jones (USA) | 22.78% |
| META | Meta Platforms, Inc. | NYSE/NASDAQ/Dow Jones (USA) | 22.14% |
| V | Visa Inc. | NYSE/NASDAQ/Dow Jones (USA) | 20.70% |
| COST | Costco Wholesale Corporation | NYSE/NASDAQ/Dow Jones (USA) | 17.19% |
| ABBV | AbbVie Inc. | NYSE/NASDAQ/Dow Jones (USA) | 16.81% |
| HD | Home Depot, Inc. (The) | NYSE/NASDAQ/Dow Jones (USA) | 16.04% |
| GOOGL | Alphabet Inc. | NYSE/NASDAQ/Dow Jones (USA) | 16.03% |
| MSFT | Microsoft Corporation | NYSE/NASDAQ/Dow Jones (USA) | 13.86% |
| UNH | UnitedHealth Group Incorporated | NYSE/NASDAQ/Dow Jones (USA) | 13.57% |
| LLY | Eli Lilly and Company | NYSE/NASDAQ/Dow Jones (USA) | 13.51% |
| JPM | JP Morgan Chase & Co. | NYSE/NASDAQ/Dow Jones (USA) | 11.25% |
| WMT | Walmart Inc. | NYSE/NASDAQ/Dow Jones (USA) | 11.23% |
| BRK-B | Berkshire Hathaway Inc. New | NYSE/NASDAQ/Dow Jones (USA) | 10.97% |
| TMO | Thermo Fisher Scientific Inc | NYSE/NASDAQ/Dow Jones (USA) | 10.72% |
| INTC | Intel Corporation | NYSE/NASDAQ/Dow Jones (USA) | 9.70% |
| DIS | Walt Disney Company (The) | NYSE/NASDAQ/Dow Jones (USA) | 9.34% |
| PEP | Pepsico, Inc. | NYSE/NASDAQ/Dow Jones (USA) | 7.88% |
| KO | Coca-Cola Company (The) | NYSE/NASDAQ/Dow Jones (USA) | 7.81% |
| CVX | Chevron Corporation | NYSE/NASDAQ/Dow Jones (USA) | 7.38% |
| JNJ | Johnson & Johnson | NYSE/NASDAQ/Dow Jones (USA) | 7.22% |
| MRK | Merck & Company, Inc. | NYSE/NASDAQ/Dow Jones (USA) | 5.71% |
| PG | Procter & Gamble Company (The) | NYSE/NASDAQ/Dow Jones (USA) | 5.54% |
| CSCO | Cisco Systems, Inc. | NYSE/NASDAQ/Dow Jones (USA) | 5.13% |
| XOM | Exxon Mobil Corporation | NYSE/NASDAQ/Dow Jones (USA) | 4.87% |
The KNZ Score is not a guarantee of future returns, nor is it a replacement for financial research. It is a statistical model designed to complement existing strategies by providing a different way of looking at historical behavior. Investors should use the KNZ Score alongside other methods before making decisions.
Over time, our goal is to expand the coverage of the KNZ Score, improve calculation efficiency, and add more interactive features to the platform so that investors worldwide can benefit from this statistical perspective.
Disclaimer: The KNZ Score is based exclusively on statistical and historical price analysis. It should not be considered financial advice. Investing in the stock market carries risks, including potential loss of capital.