Highlights
Top 5 strongest signals

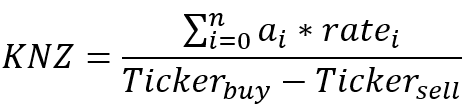
This table shows the five U.S. stocks that currently have the strongest statistical signals. Stronger signals indicate the tickers for which the KNZ statistical method identifies a higher probability of return based on analyzed historical patterns, relying exclusively on statistical data.
| Ticker | Company | KNZ | %1d | %30d | %360d | Date |
|---|
Top 5 weakest signals

This table shows the five U.S. stocks that currently have the weakest statistical signals. Weaker signals indicate the tickers for which the KNZ statistical method identifies a higher probability of loss based on analyzed historical patterns, relying exclusively on statistical data.
| Ticker | Company | KNZ | %1d | %30d | %360d | Date |
|---|