KNZ Charts

Historical Stock Analysis

Welcome to KNZ Charts

KNZ Charts provides historical statistical analysis for selected U.S.-listed stocks. The platform combines multi-period price data with the proprietary KNZ Score, a statistical indicator developed to measure relative strength and weakness in historical stock-price behavior.

The current coverage includes approximately 110 U.S.-listed stocks, with historical data spanning more than 20 years where available. Rather than attempting to predict a specific future price, KNZ Charts uses historical observations to identify how a stock has behaved across different time horizons.

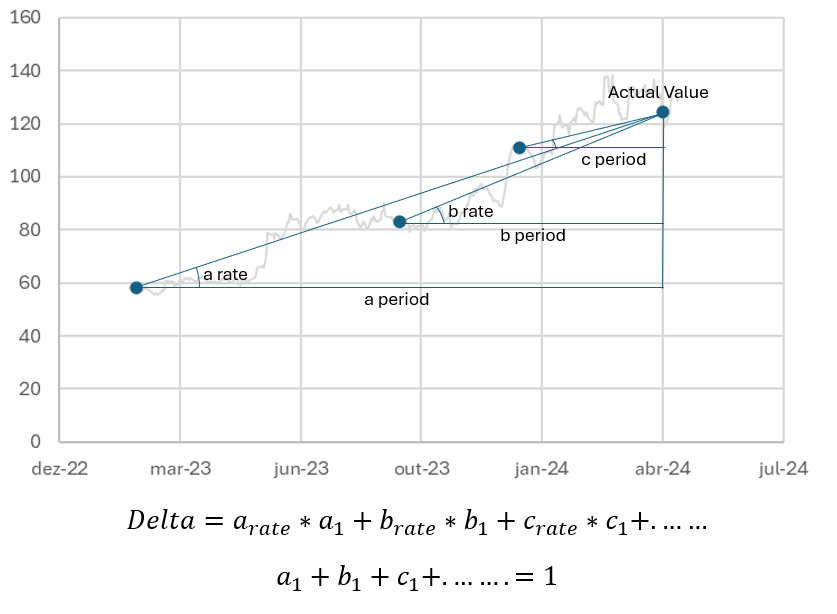
Illustration of the KNZ Charts statistical analysis methodology

Current Market Signals

Highlights

The tables below show the stocks with the strongest and weakest current KNZ Scores within the KNZ Charts coverage universe. The values are calculated from historical market data and are intended to provide a statistical perspective on recent and longer-term price behavior.

Top 5 strongest signals

These are the five stocks with the highest KNZ Scores among the securities currently covered. A higher positive score indicates stronger relative historical behavior according to the KNZ methodology. It should not be interpreted as a guarantee of future returns.

Ticker KNZ %1d %30d %360d Date

Top 5 weakest signals

These are the five stocks with the lowest KNZ Scores among the securities currently covered. A negative score indicates weaker relative historical behavior according to the KNZ methodology. It does not by itself predict that a stock will decline in the future.

Ticker KNZ %1d %30d %360d Date

Our Methodology

How the KNZ Score Works

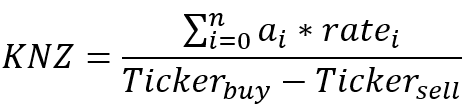
The KNZ Score is a proprietary statistical indicator based on historical stock-price behavior. Its purpose is to summarize different aspects of historical relative strength into a single score that can be used to compare stocks within the KNZ Charts coverage universe.

1

Historical Data

The methodology starts with historical price observations for each stock. KNZ Charts uses a long historical perspective, with more than 20 years of data available for the analysis where historical records permit.

2

Multiple Time Horizons

Stock behavior is evaluated across multiple horizons, including approximately 1, 7, 30, 120 and 360 trading-day periods. This allows short-term movements to be considered alongside medium- and long-term historical behavior.

3

Relative Strength

The resulting information is used to evaluate the relative strength or weakness of each stock's historical price behavior. The KNZ Score provides a standardized way to compare the current statistical characteristics of different securities.

Interpreting the KNZ Score

Positive scores

Positive KNZ Scores indicate stronger relative historical behavior according to the methodology. Higher values represent stronger statistical characteristics compared with lower-scoring stocks.

Scores near zero

A score close to zero indicates that the stock's measured characteristics are closer to the middle of the relative scale used by the KNZ methodology.

Negative scores

Negative KNZ Scores indicate weaker relative historical behavior according to the methodology. A negative score does not automatically mean that the stock will decline in the future.

Why Multiple Periods Matter

Looking at only one return period can provide an incomplete picture of a stock's historical behavior. KNZ Charts therefore presents several time horizons so users can distinguish recent movements from broader historical trends.

1 Day

Very short-term price movement.

7 Days

Short-term price behavior.

30 Days

Approximately one month of market behavior.

120 Days

Medium-term historical behavior.

360 Days

Longer-term historical perspective.

Important Information

What the KNZ Score Is — and Is Not

The KNZ Score is

  • ✓ A statistical indicator based on historical stock-price behavior.
  • ✓ A way to compare relative historical strength and weakness between stocks.
  • ✓ A multi-period analysis incorporating different historical horizons.
  • ✓ A tool for exploring historical market data and identifying statistical patterns.

The KNZ Score is not

  • ✕ A guarantee of future stock returns.
  • ✕ A prediction of a specific future stock price.
  • ✕ Personalized investment advice.
  • ✕ A substitute for fundamental, technical or other forms of investment analysis.

Important: Historical patterns can change, and past market behavior does not guarantee future results. KNZ Charts provides statistical information for research and educational purposes and should not be considered financial advice.

Using the Platform

How to Use KNZ Charts

KNZ Charts is designed to make historical stock behavior easier to explore and compare. Users can start with the overall market table and then investigate individual securities in more detail.

01

Explore the US Stocks table

Review the current KNZ Scores and historical return measures for the stocks included in the KNZ Charts coverage universe.

View US Stocks →
02

Compare tickers

Select different securities and compare their historical behavior across multiple time periods using the comparison dashboard.

Compare Stocks →
03

Study the methodology

Learn more about the KNZ Score, its historical basis, different time horizons and the limitations of statistical analysis.

KNZ Score Methodology →

Explore KNZ Charts

Main Content

Historical Data, Not Predictions

KNZ Charts is built around the idea that historical market data can provide useful information about how securities have behaved under different market conditions. The KNZ Score summarizes historical statistical characteristics to make relative comparisons easier.

However, financial markets are dynamic. Historical relationships can change, and statistical patterns observed in the past may not continue in the future. For this reason, KNZ Charts should be considered a research and educational resource rather than a prediction engine or personalized investment recommendation.